| Policy analysis | Misinformation analysis |
Sentiment analysis for selected policy
“Government and public service delivery is taking place in a changed world. A significant level of social, economic and political activity is now happening on the internet. This work explores wheter social media data can improve the quality and timeliness of the evidence base that informs public policy. Can the myriad of human connections and interactions on the web provide insight to enable government to develop better policy, understand its subsequent impact and inform the many different organisations that deliver public services?” Report for Social Media And Public Policy
The most powerful social insights presented by social media include those on:
- Politics and trust – social media contains a wealth of information about people’s engagement with mainstream politics, and how the government, police and other facets of the state are viewed across populations.
- Sentiment and attitude – social media provide access to population level data concerning sentiments and attitudes on all aspects of social, economic and cultural life. Analysis of this data that can help us predict social, political and/or economic actions.
- Health and well–being – researchers can gain data about the health and well–being of people through social media at levels of detail and scale that were previously impossible.
- Information diffusion – social media is now central to the flow and spread of all kinds of information. Researchers can track these flows to understand how different types of knowledge gain currency and influence.
In this work, we will use publicly aviable information on social media to study 1) how people’s feeling and sentiment for the recent policies related to COVID-19, and 2) how the misinformation about COVID-19 will be diffused to impact the national healthcare system. All data used in this work comes from publicly available information on social media platform. The analytics results is for research usage only.
Case 1: Additional $1,100 per fortnight payment to JobSeekers/NewStarts
You may get a payment from Service Australiai (formerly known as Centrelink) if you or your family are affected by the coronavirus pandemic. You may get 1 of the following payments: Youth Allowance, JobSeeker (Newstart) Payment, and Parenting Payment. That is an additional payment for $1100 per fortnight that is doubling the orginal JobSeeker allowance. (policy link).
To find more policy about Department of Social Services, please look at below links. Depart of Social Service and Minister of DSS
Interactive map
This funcion is composed of three frames. The first frame is to choose configurations for map, the second frame is the MAP to display sum of counts over districts, and the third frame is to display the detailed staticial information for the selected district. The arrangment could be vertical (preferred) or horizontal (as shown in picture).
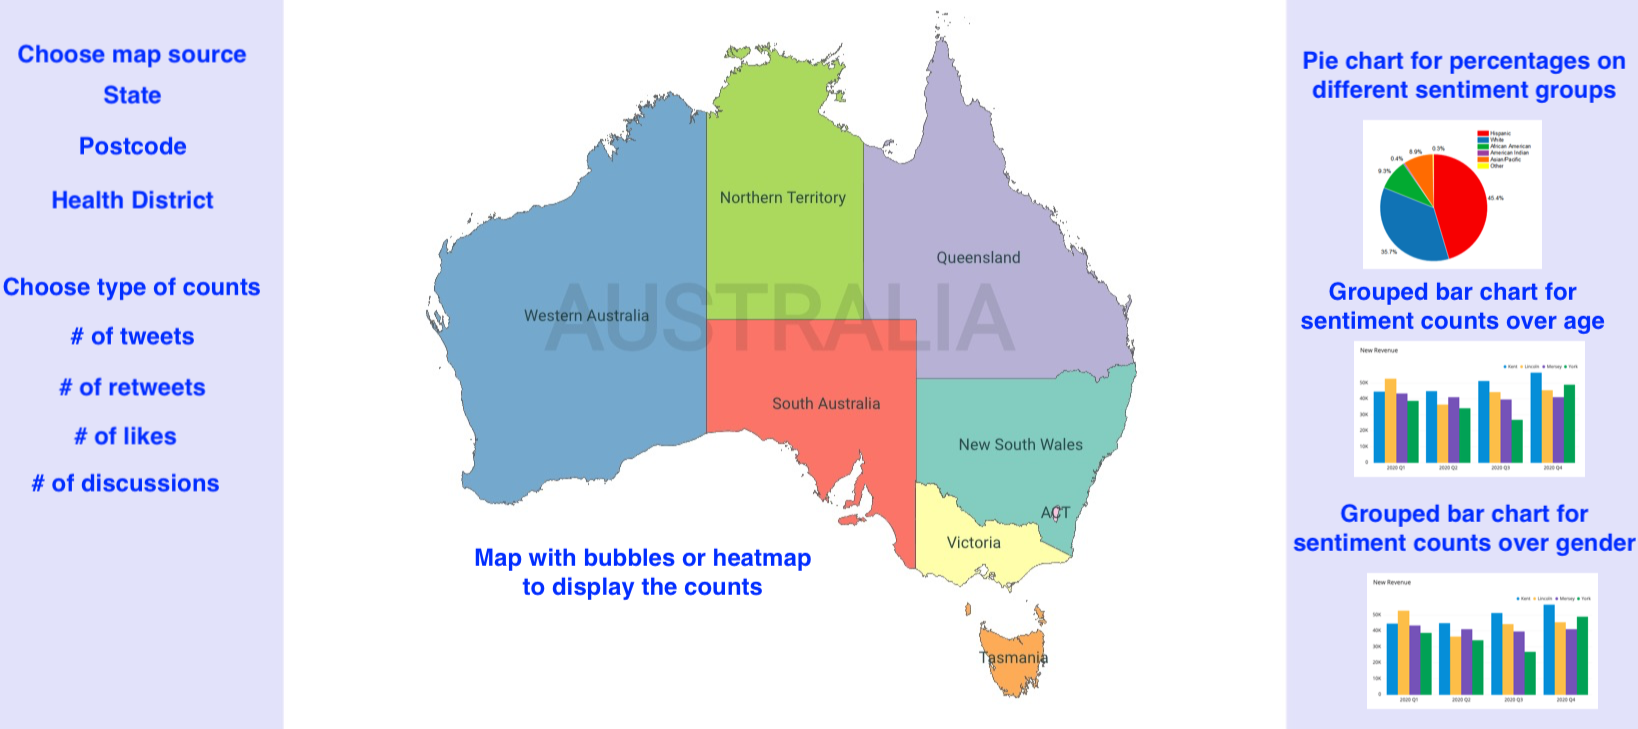
- Interactive map «<click it to see the interactive demo
- Figure 1: An interactive map for summarised counts over locations.
- Descriptions: … … … …
Statistic analysis for sentiment analysis
Each figure will occupy one page as similar to COVID19 analytics report.
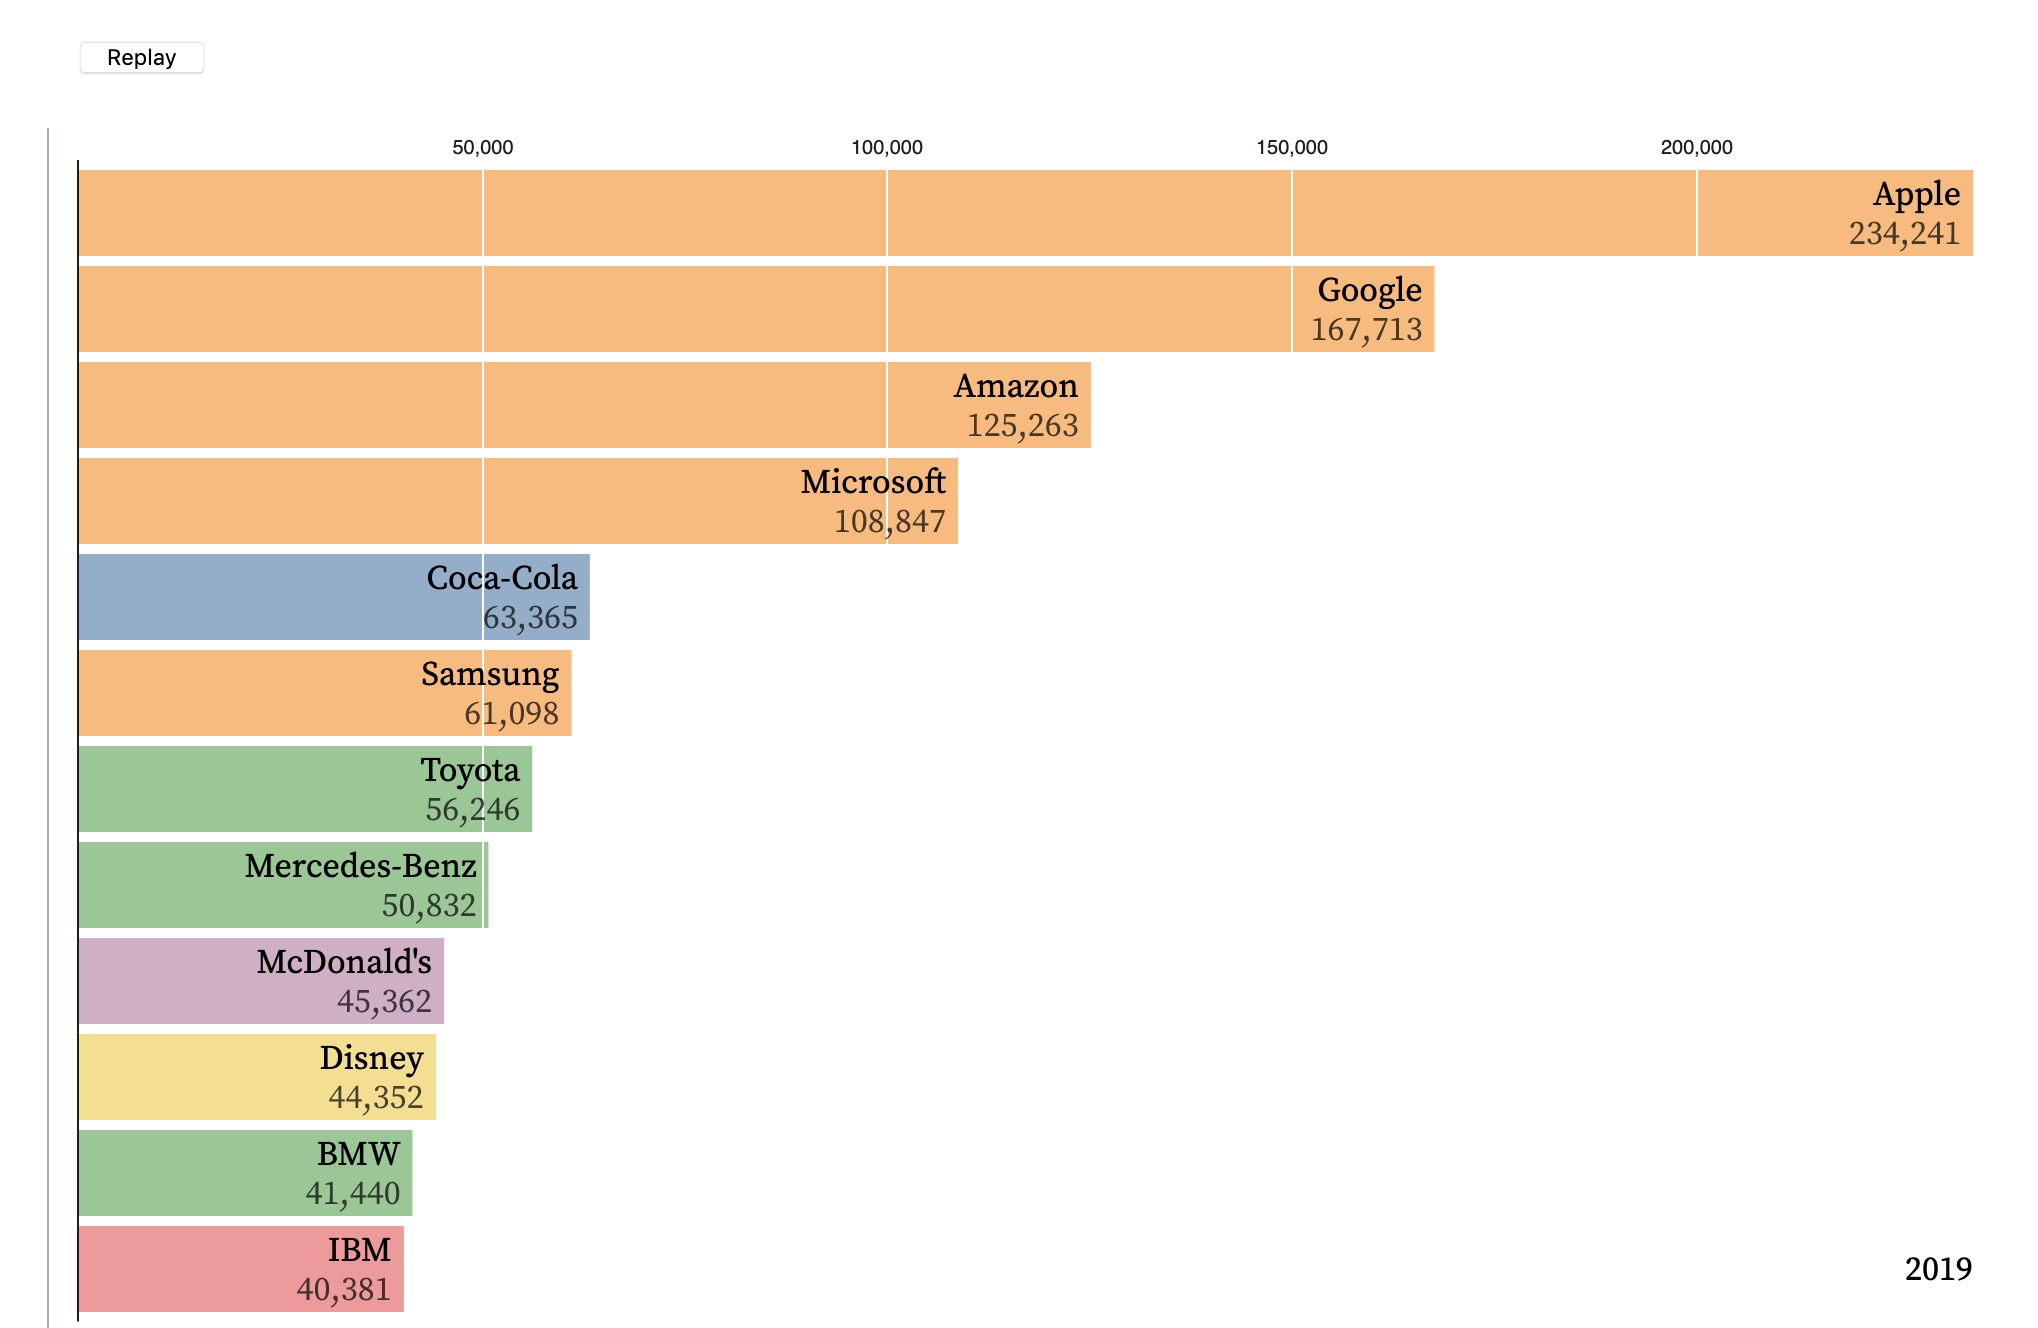
- Bar chart race«<click it to see the interactive demo
- Figure 5: Sentiment trends over time for selected policy (counted on # of tweets)
- Descriptions: … … … …
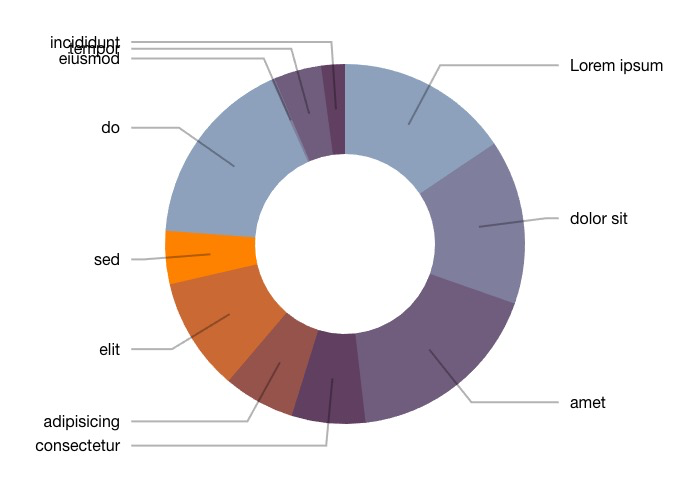
- Pie chart«<click it to see the interactive demo
- Figure 1: Percentage for different sentiment groups.
- Descriptions: … … … …
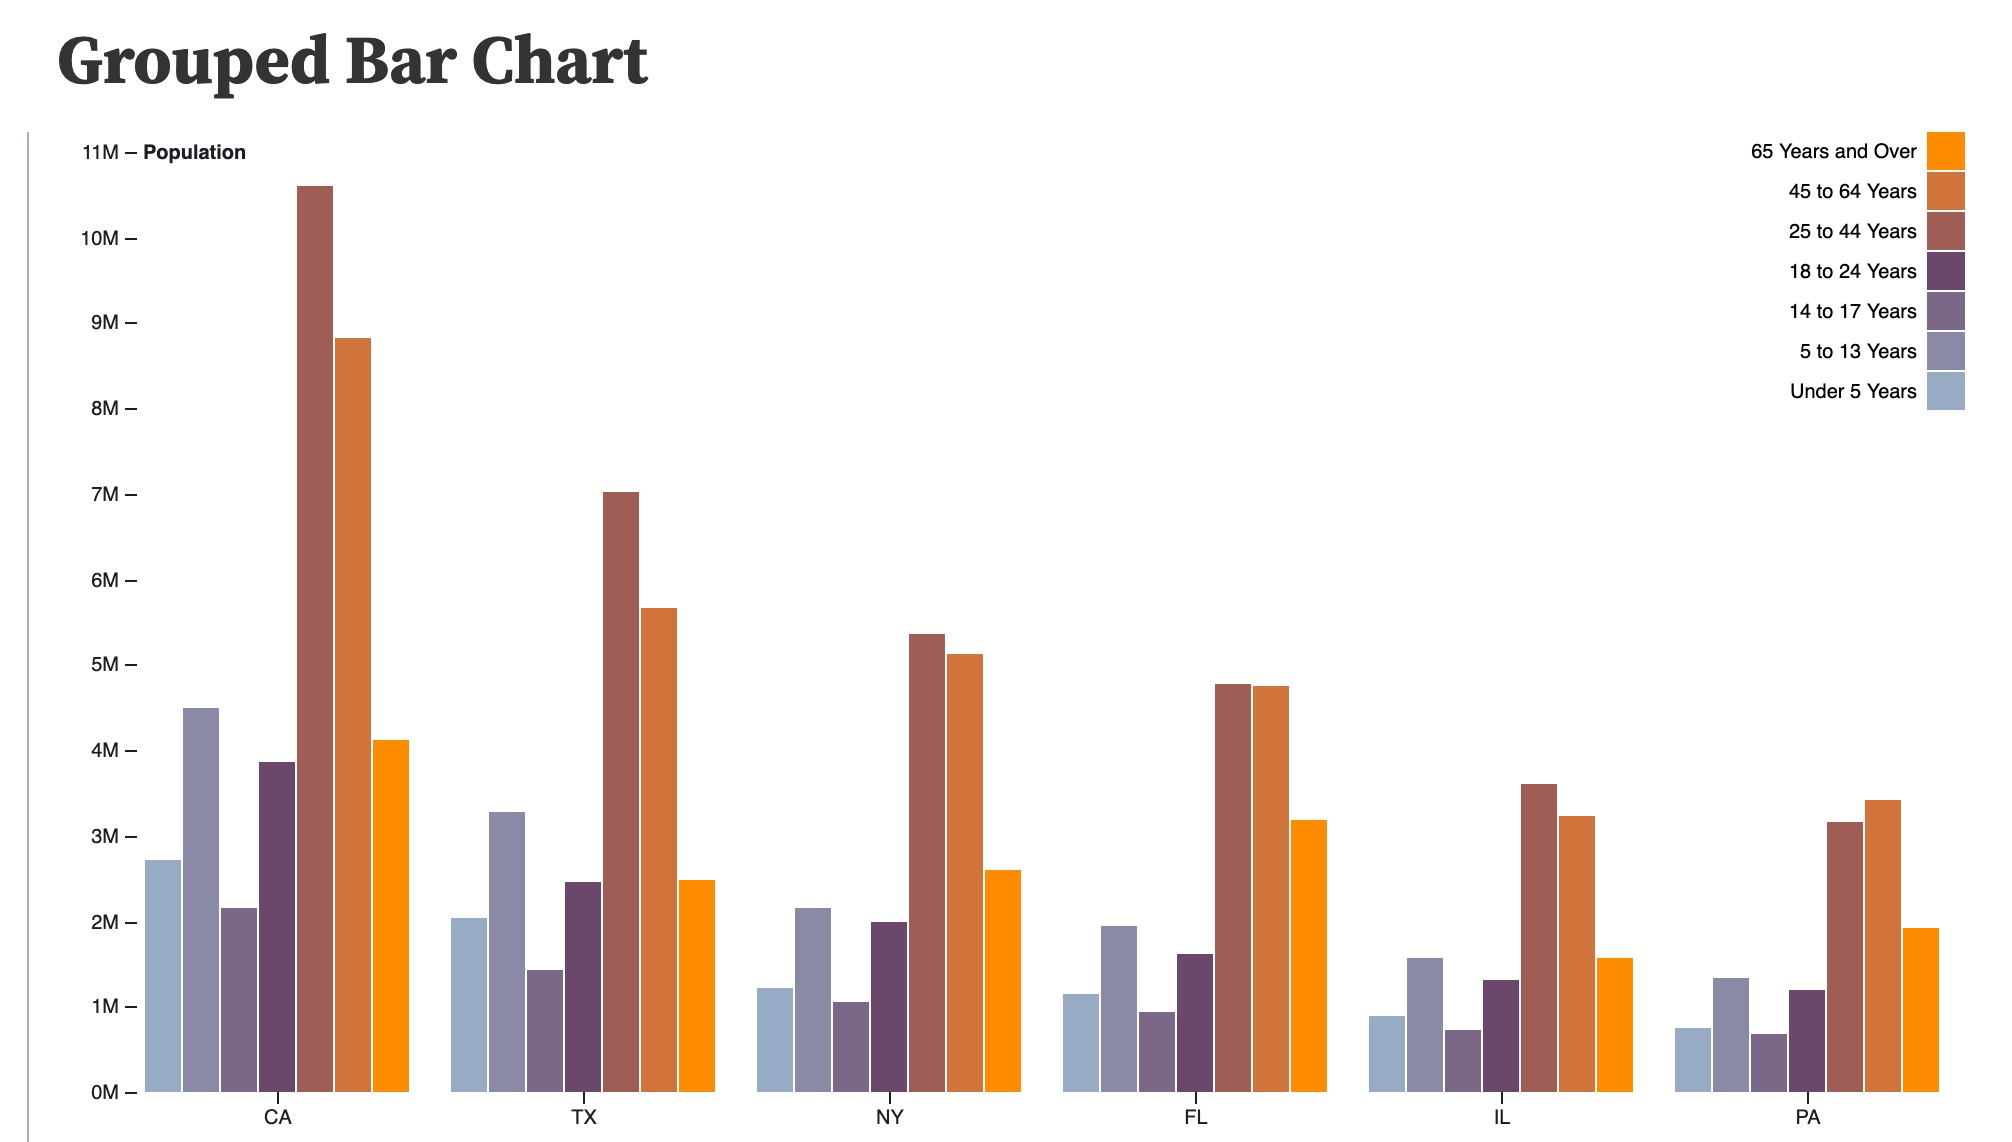
- Grouped bar chart«<click it to see the interactive demo
- Figure 2: Sentiment comparison (counted on # of tweets, # or persons/accounts, # of retweets, # of likes, # of discussions) on different age level.
- Descriptions: … … … …
- Grouped bar chart«<click it to see the interactive demo
- Figure 3: Sentiment comparison (counted on # of tweets, # or persons/accounts, # of retweets, # of likes, # of discussions) on different gender.
- Descriptions: … … … …
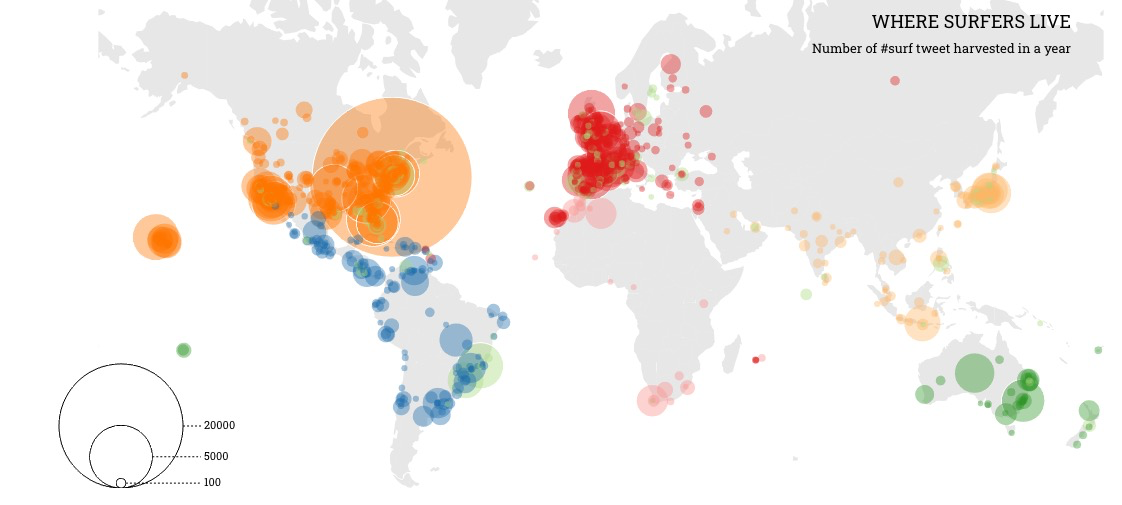
-Bubble map«<click it to see the interactive demo
- Figure 4: Sentiment comparison (counted on # of tweets, # or persons/accounts, # of retweets, # of likes, # of discussions) on different state.
- Descriptions: … … … …
Topic summarisation
Each figure will occupy one page. Moreover, each word is linked to a list of related tweets that is ranked by the impact (# of retweets + # of likes).
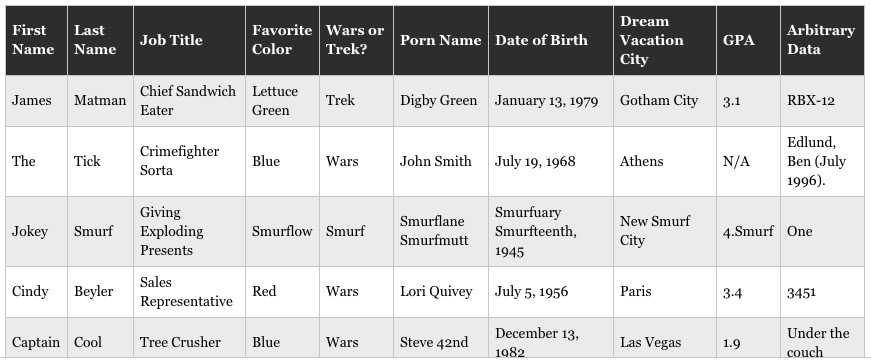
- Table chart«<click it to see the interactive demo
- Figure 1: an overall list of topics derived from the tweets using topic modelling.
- Descriptions: … … … …
- Table chart«<click it to see the interactive demo
- Figure 2: topics derived from different sentiment groups.
- Descriptions: … … … …
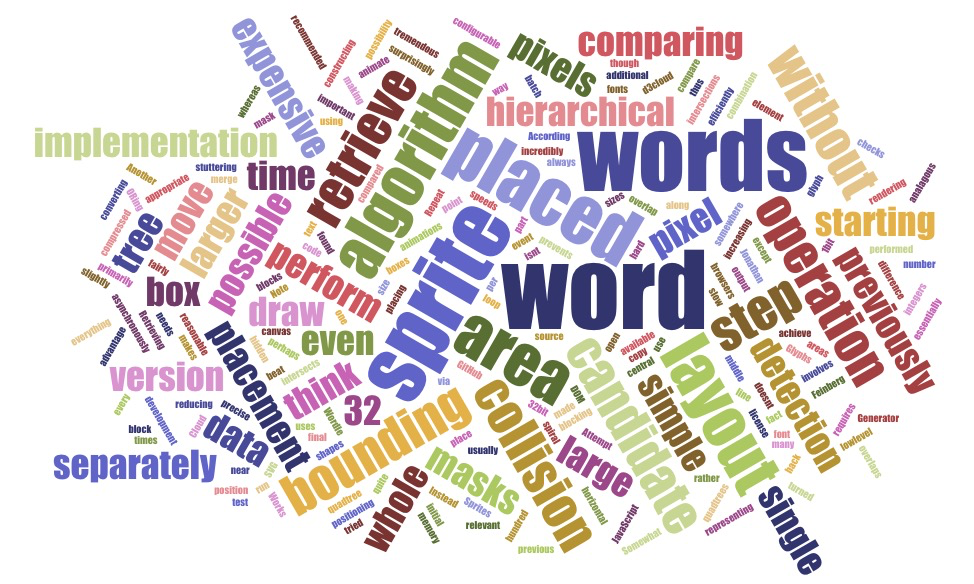
- Word-cloud«<click it to see the interactive demo
- Figure 3: an overall word-cloud for all extracted tweets.
- Descriptions: … … … …
- Word-cloud«<click it to see the interactive demo
- Figure 4: word-cloud dervied from different sentiment groups.
- Descriptions: … … … …
Twitter Hashtags or Keywords
#JobSeeker, #Newstart (#Centrelink, #ServiceAustralia, #COVID-19) About this policy, there are sveral kinds of discussion:
- Label 1: Critised/Negative comments - mainly from ineligble population who feel unfair.
- Label 2: Compliment/Positive comments - mainly from eligble population who benefit from this policy.
- Label 3: Suggestive/Neutral comments - Sugget to cover more populations with difficulties - normally from politic people
- Label 4: Informative/Neutral comments - Diffusing the information or willing to provide assitance or support related to this policy.
- Label 5: Other related comments - the comments is related to the policy but canot be categorised to above labels.
- Label 6: Unrelated information - the comments are not related to the policy.
All tweets will be categorised to the above five classes. In particular, Label 1 belongs to negative, Label 2 belongs to positive, label 3~5 belongs to neural comments.
Labeling process with active learning framework
- Step 1: extracting 20,000 tweets (instances in machine learning terminology) from the date of policy published.
- Step 2: randomly selecting 1% instances (say 200)
- Step 3: asking four assessors (two males and two females with different background) to label the selected instances.
- Step 4: training a multi-class classifier using BERT or Bi-LSTM or Random Forest or Gradient Boosting, and then use the classifier to predict the pesudo label for all unlabelled instances. .
- Step 5: selecting another 1% unlabelled instances with the most uncentain prediction, and then go to Step 3 till K rounds (say K=5) or accuracy/precision/F1-score achieve the desired fiigure (say 80%). Different assessors in each round are preferred.